Imagine using a pencil and paper to track all of the big data generated by the smart grid. That would be downright impossible, right? But up until recently, the Sacramento Municipal Utility District (SMUD (News - Alert)) in California has been using a system nearly as archaic to manage its operations.
SMUD is the nation’s sixth largest community-owned electric utility, serving a population of 1.4 million across 900 square miles. For some time, the utility has relied on paper maps—including a 100 x 25 ft. wall map – and the experience and knowledge of its personnel to manage the electric grid. But the recent adoption of smart grid infrastructure generated an exponential increase in the volume of data, making manual operations infeasible and creating opportunities for real-time insight into grid performance.
Among the challenges the utility faced were that distributed generation limited SMUD’s ability to analyze information quickly and correlate real-time data; the implications of changes in one part of the grid on other assets were harder to assess; and planning the rollout of new assets became a highly complex task. As Tim Van Blaricom, manager of Grid Operations, commented, “We simply needed a way to synthesize a huge amount of information.”
Now, the utility has adopted geospatial and visual analytics software from Fremont, Calif.-based Space-Time Insight that quickly synthesizes numerous streams of data and provides on-the-fly assessments of grid and asset health, weather, wind and fire conditions, and power supply and demand, to name a few. The system helps SMUD managers and operators to respond more quickly to outages—rapidly develop switching plans, and make more-informed decisions regarding equipment maintenance and investments.
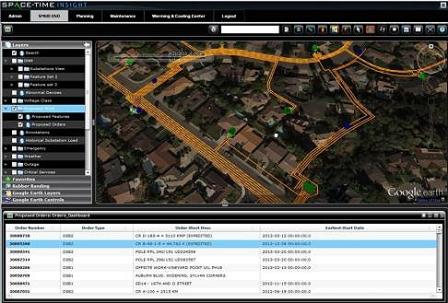
Above, a screenshot from Sacramento Muncipal Utility District’s new geospatial and visual analytics software from Fremont, Calif.-based Space-Time Insight.
Indeed, the analytics platform has become the primary “face” of SMUD’s new Distribution Operations Center. The solution was implemented as part of SMUD’s Situational Awareness and Visual Intelligence (SAVI) initiative—which is designed to improve the speed and quality of data analysis and decision-making throughout the organization’s Grid Planning and Operations department. Inside SMUD’s Distribution Operations Center, the visualizations can be viewed on a 30 x 8 ft. video wall and on users’ desktops and mobile devices. SMUD’s SAVI project is partially funded by a federal smart grid grant awarded by the U.S. Department of Energy.
“The volume of data generated by our smart assets made it clear that we had to continue to innovate to improve the reliability and safety of service to our customers,” said Paul Lau, assistant general manager, Power Supply and Grid Operations at SMUD. “With common operational views, personnel across our organization can now implement more cost-effective asset planning and maintenance practices, collaborate as one team to respond rapidly to emergency situations and outages, and more readily understand the real-time impact of weather and fires on our daily operations.”
“As organizations like SMUD bring smart assets into their infrastructure, the static reports, spreadsheets and tools that inform decisions based on yesterday’s data are simply inadequate for running an operation,” said Rob Schilling, CEO of Space-Time Insight. “The whole point of collecting all this granular data is to use it to improve service reliability and efficiency. We commend SMUD for recognizing the value of this data and for taking the initiative to extract valuable insights from the smart technologies in which they are investing.”
Edited by
Alisen Downey